Monday, August 22, 2022

File formats in Big data:


As a data engineer, quite frequently you will have to face use cases where you need to deal with different types of file formats.

Text file: 
It is also called a flat file and is the simplest among all file formats. I mostly used it to store unstructured data like log files or have received raw delimited structured data in this format.

CSV File:
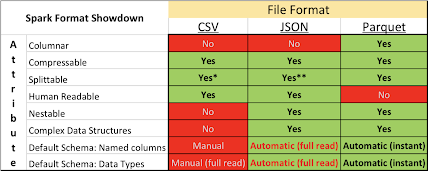
CSV files are a common way to transfer data. The files are not compressed by default. Pandas and pyspark support reading and writing to CSVs. This is the file format that I have used most to get data from the different source systems.

JSON:
JavaScript Object Notation is a lightweight data-interchange format. JSON is one of the best tools for sharing data of any size and type. That is one reason, many APIs and Web Services return data as JSON.JSON files are not compressed by default. Pandas and Pyspark support reading and writing to JSON. I have also used it to store the metadata or schema structure of my datasets and have also received responses from APIs in JSON format.

Apache Parquet: 
This is a big data file format and stores data in machine-readable binary format, unlike CSV and JSON formats which are human-readable. It is columnar format and data is optimized for fast retrieval. By columnar format, it means data is written column by column. This is ideal for read-heavy analytical workloads. Parquet also stores metadata at the end of the files containing useful statistics such as schema info, column min, and max values, compression/encoding scheme, etc making them self-describing. This enables data skipping and allows for splitting the data across multiple machines for large-scale parallel data processing. Parquet supports efficient data compression and encoding schemes that can lower data storage costs. Most of my datasets are saved in this format. Pandas and pyspark support reading and writing to parquet files.

Apache Avro:
This is also another big data file format and stores data in binary format. It is a row-based data store which means that data is optimized for “write-heavy” workloads and data is stored row by row. Avro file format is considered in cases where I/O patterns are more write-heavy, or the query patterns favor retrieving multiple rows of records in their entirety. For example, the Avro format works well with a message bus such as Event Hub or Kafka that write multiple events/messages in succession. I have not used this format yet.

Protocol Buffers: 
They are Google's language-neutral, platform-neutral, extensible mechanism for serializing structured data – think XML, but smaller, faster, and simpler. Used as API response. 

Other file formats are Optimized Row-Columnar (ORC), PDF,XML,XLSX File.


SQL Series-CTEs


Common Table Expressions(CTEs) in Advanced Analytics

After evolution of advanced analytics, use of advance SQL functions (CTE, Windows functions) are very wide. we are going to see CTEs in this post. Common Table Expressions(CTEs) are a SQL functionality that allows you to perform complex, multi-step transformations in a single easy-to-read query.
What are CTEs?
CTE is a temporary named result set that is not store/saved anywhere, exists in memory while querying.
How do CTEs work?
This CTE result set only available within execution scope of a specific statement, which means this result set are only available to the CRUD statement following the WITH clause in CTE query.
Why do we need CTEs?
1.      CTEs solve “logic on top of logic” problems. This happens when you have to perform data manipulation and then use the resulting dataset to perform further more manipulation.
2.      CTEs make your code Better readable, Reusable.

Where do we use CTEs?
1.      When you need to break up a long, complex query into chunks of logic that can be referenced in your final query. They are a great way to help you write more DRY code in your data analysis and dbt models (where you are used same data in multiple subqueries).
2.      CTEs can be used to create recursive queries, which is helpful as a normal SELECT statement cannot reference itself.

When do we use CTEs? (Use Cases):
CTEs are helpful in whenever subqueries are needed.
1.      They are used to create Cohort tables (appears in many technical tests).
2.      Determine Rank (lowest, second-lowest)
3.      Category grouping before further grouping


Sunday, August 21, 2022

How to choose right chart types?


 How to choose right chart type in Data Visualization?


When working on any data science projects, explore and interpret your results via visuals is very Crucial step, which helps understand data better, find patterns and trends. The data visualization will help you communicate your results more efficiently at the end. There are many chart types, process of choosing the correct one can be overwhelming and confusing.

Before you start looking at chart types, ask yourself 5 questions:

What the story your data is trying to deliver?
Data is just a story told in numbers. Understanding of Origin and what it’s trying to deliver help to choose right chart type.

Who will you present your results to?
Based on your audience, the interpretation will vary, which helps to choose right chart type to communicate more efficiently with them.

How big is your data?
Pie charts work best with a small dataset. Scatter plot will make more sense to larger dataset. choosing right chart type that fits the size of your data best and represents it clearly without cluttering.

What is your data type?
As you know, there are several types of data, describe, continuous, qualitative or categorical. The data type of your data will eliminate some chart types. For example
For Continuous data-line chart will be best choice instead of bar chart. For Categorical data-bar or pie chart will be best choice instead of line chart.

How do the different elements of your data relate to each other?
Is your data order based on some factor — time, size, type? Is your data a time-series — data that changes over time? Or is it more of a distribution? The relationship between data elements help to choose a right chart type to use a bit more straightforward.

Best practice on chart selection:

--If you have categorical data, use a bar chart if you have more than 5 categories or a pie chart otherwise.
--If you have nominal data, use bar charts or histograms if your data is discrete, or line/ area charts if it is continuous.
--If you want to show the relationship between values in your dataset, use a scatter plot, bubble chart, or line charts.
--If you want to compare values, use a pie chart — for relative comparison — or bar charts — for precise comparison.
--If you want to compare volumes, use an area chart or a bubble chart.
--If you want to show trends and patterns in your data, use a line chart, bar chart, or scatter plot.


File vs Object vs Block storage


Which data storage should I use?

File vs Object vs Block storage:

After emerging of social media, data platform has evolved in respect of data storage, and processing methods to handle unstructured data. We are going to see the difference between file, block, and object storage and its pros and cons in this post.

1. File storage:

In this, all the data stored are saved together in a single file with an extension type determined by the application/tool used to create the same (Ex: .jpg,.docx,.txt). File storage uses hierarchical storage where files are organized by the user in folders and subfolders, which helps search and manage files. Mostly we manage file storage through a simple file system such as File manager.

Pros:
1.      Easy to access on a small scale.
2.      Familiar to most users
3.      Users can manage their own files
4.      Allows access rights/file sharing/file locking with the password.

Cons:
1.      Challenging to manage and retrieve large numbers of files:
2.      Hard to work with unstructured data
3.      Becomes expensive at large scales: 

Use cases for file storage:
1.      Collaboration of documents across cloud storage or Local Area Network (LAN)
2.      Backup and recovery:
3.      Archiving: due to its security and simplicity of management.

2. Block storage: 
In this storage system, the data is split into fixed blocks of data and then stored separately with unique identifiers. The blocks can be stored in different environments, such as one block in Windows and the rest in Linux. When a user retrieves a block, the storage system reassembles the blocks into a single unit. Block storage is the default storage for both hard disk drives and frequently updated data. You can store blocks on Storage Area Networks (SANs) or in cloud storage environments.

Examples: Amazon Elastic Block Store (Amazon EBS), Azure Disk Storage, Persistent Disk, and Local SSD in google.

Pros:
1.    Fast 2.Reliable: 3. Easy to modify

Cons:
1.      Lack of metadata, 2.Not searchable 3. High cost

Use cases for block storage:
1.  Databases. 
2. Email servers. 
3. Virtual machine file system (VMFS)

3. Object storage:

The object storage is a system that divides data into separate, self-contained units stored at the same level. No folders or sub-directories. Objects also contain metadata, which helps with processing and usability. Users can customize their keys and values based on their needs. Instead of the path, each object has a unique number. Objects can be stored locally on computer hard drives and cloud servers. but it manages via an Application Programming Interface (API).

Pros:
1. Handles a large volume of unstructured data 
2. Affordability, 
3. Advance search capacity

Cons:
1. Can't modify a portion 
2. slow performance 
3. Can't lock
1.IOT, 
3. Video surveillance

Examples: Amazon s3, Azure Blob
The detailed information is summarized in the below pic.


Spark- Window Function

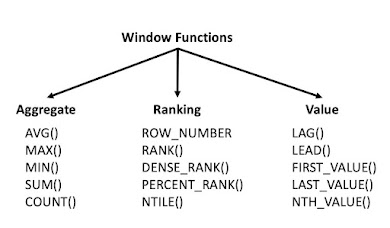
  Window functions in Spark ================================================ -> Spark Window functions operate on a group of rows like pa...